Acknowledging the DHSR in publications
Please remember to acknowledge the DHSR in your publications, in talks, and on posters. Use the text below that is appropriate:
| For whole slide imaging and quantification: |
| Whole slide imaging and quantification of immunostaining were performed in the Digital Histology Shared Resource at Vanderbilt University Medical Center (vumc.org/dhsr). |
| For whole slide imaging: |
| Whole slide imaging was performed in the Digital Histology Shared Resource at Vanderbilt University Medical Center (vumc.org/dhsr). |
| For deconvolution microscopy: |
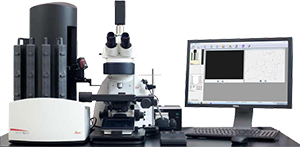
| Deconvolution microscopy was performed on the DeltaVision Imaging System (Applied Precision/GE Healthcare) in the Digital Histology Shared Resource at Vanderbilt University Medical Center (vumc.org/dhsr). |
| For colony counting: |
| Colony imaging and quantification was performed on the GelCount System (Oxford Optronix) in the Digital Histology Shared Resource at Vanderbilt University Medical Center (vumc.org/dhsr). |
Example texts for materials and methods:
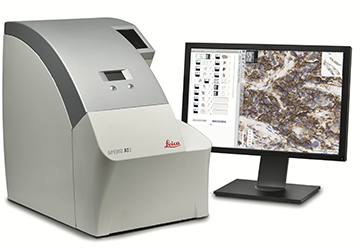
Images were captured using a high throughput Leica SCN400 Slide Scanner automated digital image system from Leica Microsystems. Whole slides were imaged at 20X magnification to a resolution of 0.5 µm/pixel. Tissue cores were mapped using Ariol Review software. The numbers of positive (brown) and negative (blue) nuclei were determined by analysis of the high-resolution images in the Ariol software.
Immunostained tissue microarray slides were imaged on a Leica SCN400 Slide Scanner (Leica Biosystems). Tissue cores were imaged at 20X magnification to a resolution of 0.5 μm/pixel. Cells were identified utilizing standard Ariol analysis scripts. (Leica) Upper and lower thresholds for color, saturation, intensity, size, roundness, and axis length were set for both blue Hematoxylin staining of nuclei and for brown DAB reaction products. Thus, brown (DAB) positive cells can be distinguished from blue (Hematoxylin only) negative cells. The area of positive staining per core was calculated as a percent of the total analyzed area divided by area of brown (DAB-positive) pixels.
Fluorescent, immunostained tissue slides were imaged on an Aperio Versa 200 automated slide scanner (Leica Biosystems). Tissue cores were imaged at 20X magnification to a resolution of 0.323 µm/pixel...
Actual Pixel Scales
| Aperio AT2 or Leica SCN400 Bright Field | Aperio Versa 200 | Aperio Versa 200 | |
| 5X : | 2 µm/pixel | 1.10 µm/pixel | 1.30 µm/pixel |
| 10X : | 1 µm/pixel | 0.547 µm/pixel | 0.648 µm/pixel |
| 20X : | 0.5 µm/pixel | 0.273 µm/pixel | 0.325 µm/pixel |
| 40X : | 0.25 µm/pixel | 0.136 µm/pixel | 0.162 µm/pixel |
User Guides
|
Adipose Segmentation
|

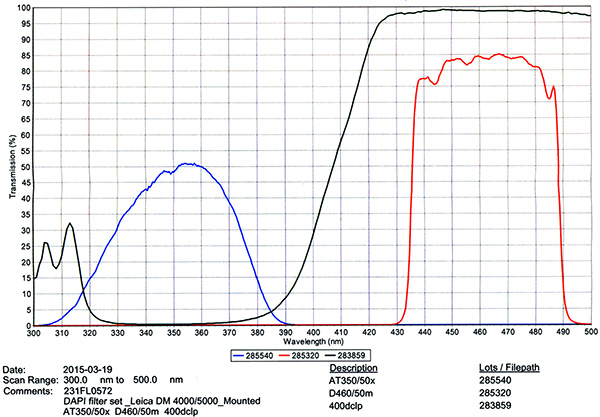
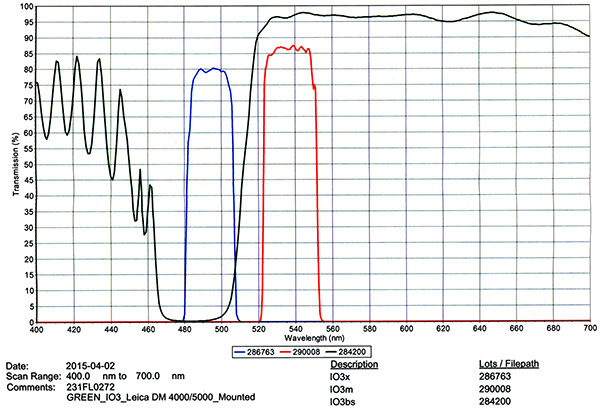
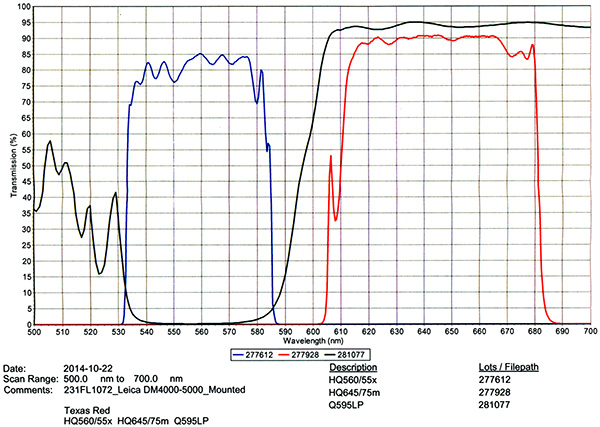
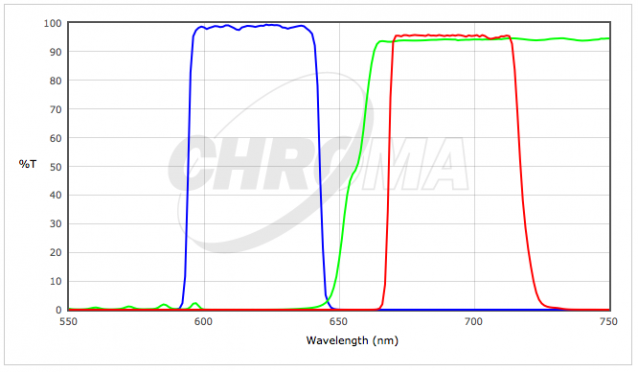
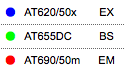
Filter Cube Specs
| 1) | Chroma #C168806 - DAPI Filter Cube | |
| ||
| 2) | Chroma #C169110 Spectrum Green Filter Cube | |
|
| |
| 3) | Chroma #C165857 - Texas Red (TxRed) Filter Cube | |
|
| |
| 4) | Chroma #39007 - AT - Cy5/AlexaFluor 647/Draq5 | |
|
| |
| 5) | Chroma #49007 - ET - Cy7 | |
|
|