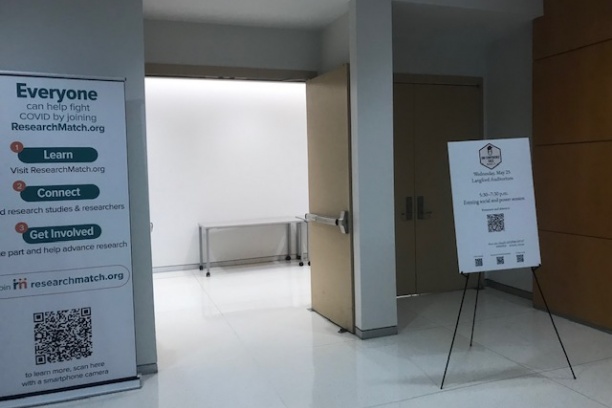

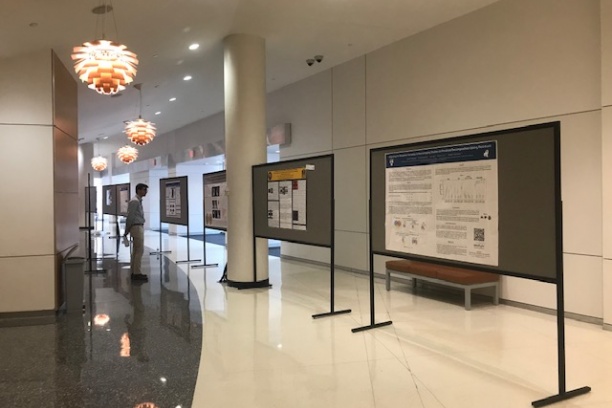

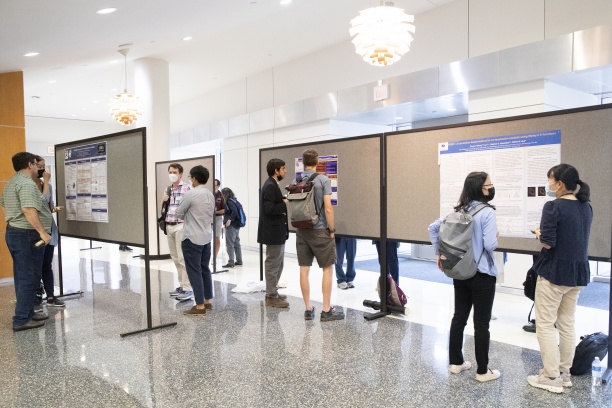


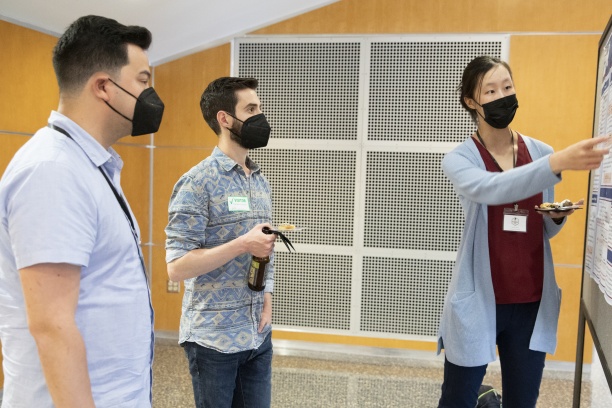
The in-person poster session and evening social took place on Wednesday, May 25, from 5:30 to 7:30 p.m. in Vanderbilt University Medical Center's Langford Auditorium.
Posters are listed here by presenter, in reverse alphabetical order.
Group DICA procedure for multiple subjects DTI data
Guangming Yang, Emory University
with Ying Guo
There have few investigations in implementing multi-subject ICA analysis for DTI data. The major obstacle has been how to organize the diffusion tensors across different subjects for ICA decomposition. However, the newly proposed Distributional ICA method (Wu, 2021) provides a re-representation for the DTI tensor data, which enables us to combine diffusion MRI images from different subjects and implement ICA decomposition. In this poster, we present a pipeline based on the Distributional ICA framework to analyze multi-subject DTI data.
Adjusting for nuisance variables in neuroimaging studies via penalized decomposition using residuals
Sarah M. Weinstein, University of Pennsylvania
with Christos Davatzikos, Jimit Doshi, Kristin A. Linn, and Russell T. Shinohara
In neuroimaging studies, multivariate methods provide a framework for studying associations between patterns in the brain and neurological, psychiatric, and behavioral phenotypes. However, mitigating the influence of nuisance variables, such as confounders, remains a critical challenge in multivariate pattern analysis (MVPA). In studies of Alzheimer's Disease, imbalance in disease rates across age and sex may make it difficult to distinguish between structural patterns in the brain attributable to disease progression and those characteristic of typical human aging or sex differences. Concerningly, when not properly adjusted for, nuisance variables can obscure interpretations and preclude the generalizability of findings from neuroimaging studies. Motivated by this critical issue, in this work we examine the impact of nuisance variables on features extracted from image decomposition methods and propose Penalized Decomposition Using Residuals (PeDecURe), a new MVPA method for obtaining nuisance variable-adjusted features. PeDecURe estimates primary directions of variation which maximize covariance between residualized imaging features and a variable of interest (e.g., Alzheimer's diagnosis) while simultaneously mitigating the influence of nuisance variation through a penalty on the covariance between residualized imaging features and those variables. Using features estimated using PeDecURe's first direction of variation, we train an accurate and generalizable predictive model, as evidenced by its robustness in testing samples with different underlying nuisance variable distributions. We compare PeDecURe to commonly used decomposition methods (principal component analysis (PCA) and partial least squares) as well as a confounder-adjusted variation of PCA. We find that features derived from PeDecURe offer greater accuracy and generalizability and lower partial correlations with nuisance variables compared with the other methods. While PeDecURe is primarily motivated by MVPA in the context of neuroimaging, it is broadly applicable to datasets where the dimensionality or complexity of the covariance structure calls for novel methods to handle sources of nuisance variation.
Whole-brain directed network analysis of fMRI data
Yaotian Wang, University of Pittsburgh
with Guofen Yan, Xiaofeng Wang, Shuoran Li, Lingyi Peng, Dana L. Tudorascu, and Tingting Zhang
The brain is a high-dimensional directed network system, as it consists of many regions as network nodes that exert influence on each other. We aim to reveal whole-brain directed networks based on resting-state functional magnetic resonance imaging (fMRI) data of many subjects. However, it is both statistically and computationally challenging to produce scientifically meaningful estimates of whole-brain directed networks. To address the statistical modeling challenge, we assume modular brain networks, which reflect functional specialization and functional integration of the brain. We address the computational challenge by developing a variational Bayesian method to estimate the new model. We apply our method to resting-state fMRI data of many subjects and identify modules and directed connections in whole-brain directed networks. The identified modules are accordant with functional brain systems specialized for different functions. We also detect directed connections between functionally specialized modules, which, in contrast, are not attainable by existing network methods based on functional connectivity. In summary, this poster presents a new computationally efficient and flexible method for directed network studies of the brain, as well as new scientific findings regarding the functional organization of the human brain.
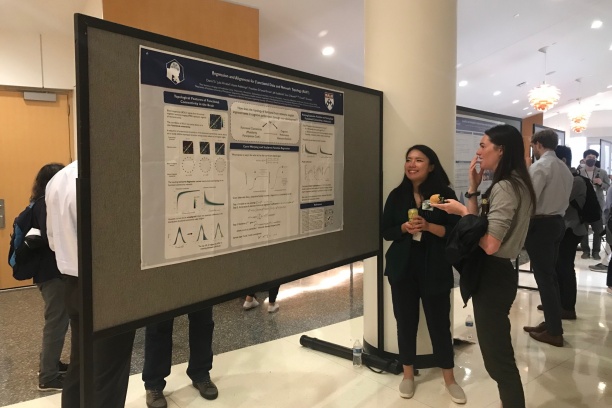
Regression and alignment for functional data and network topology
Danni Tu, University of Pennsylvania
with Julia Wrobel, Azeez Adebimpe, Theodore D. Satterthwaite, Jeff Goldsmith, Dani S. Bassett, and Russell T. Shinohara
The human functional brain network dynamically reorganizes during adolescence. Changes in mesoscale topology can be assessed by modularity and participation coefficient, two diagnostics which capture the community structure of the brain network. By proportionally thresholding the network edges, we obtain a sequence of diagnostics for each threshold, resulting in diagnostic curves that describe network structure at multiple scales. Previous methods that evaluate network diagnostic curves have relied on permutation-based or pointwise comparisons, which are less powerful and less informative than comparisons of curves in their entirety. We propose a functional regression framework that uses functional principal components analysis (FPCA) to characterize how curves vary among individuals. To address biases introduced by systematic differences in the distribution of edge strengths between networks, we conceptualize these differences as phase variation in diagnostic curves. Our novel method therefore simultaneously performs regression and curve alignment through an iterative, penalized estimation procedure. The illustrated procedure is widely applicable to domains of neuroscience where the goal is to study heterogeneity among a mixture of function- and scalar-valued measures.
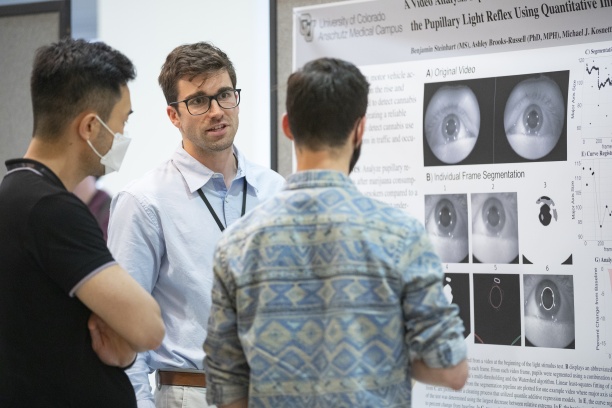
A video analysis pipeline for detecting differences in pupil dilation across marijuana user groups
Benjamin Steinhart, University of Colorado
with Ashley Brooks-Russell, Michael Kosnett, James Sherrick, and Julia Wrobel
We developed a video processing and analysis pipeline that extracts pupil sizes over time during a light stimulus test administered in a virtual reality headset. The analysis compares pupil size trajectories across cannabis user groups before and after smoking. Participants completed an ocular assessment at baseline and again after consuming marijuana or after a waiting period for non-users. From each video frame, pupils were segmented using a combination of image pre-processing techniques and segmentation algorithms, notably Otsu’s multi-thresholding and the Watershed algorithm. Linear least-squares fitting of an ellipse estimated pupil size from a binary image. Percent change from baseline in major-axis size was calculated at each frame producing pupil size trajectories over the duration of the light stimulus test. Scalar features capturing minimum constriction and rebound dilation were analyzed using generalized estimating equations. Compared to non-users, both occasional and daily users showed significantly less pupil constriction, and daily users had higher levels of rebound dilation (measured by AUC) at their post-assessment relative to their baselines (p < 0.001 and p = 0.025, respectively). Our results suggest using virtual reality goggles and an accurate segmentation and analysis pipeline may enable objective measurement of when one has been driving after marijuana use.
A full Bayesian approach to SENSE image reconstruction increases brain tissue contrast and reduces noise leading to more statistically significant task activation
Chase Sakitis, Marquette University
with Andrew Brown and Daniel Rowe
In fMRI, capturing cognitive temporal dynamics is dependent on how quickly volume brain images are acquired. The sampling time for an array of spatial frequencies to reconstruct an image is the limiting factor in the fMRI process. Multi-coil Sensitivity Encoding (SENSE) image reconstruction is a parallel imaging technique that has greatly reduced image scan time. In SENSE image reconstruction, coil sensitivities are estimated once from a priori calibration images and used as fixed “known” coil sensitivities for image reconstruction of every subsequent image. This technique utilizes complex-valued least squares estimation via the normal equation to estimate voxel values for the reconstructed image. This method can encounter difficulty in estimating voxel values if the SENSE design matrix is not positive definite. Here, we propose a Bayesian approach where prior distributions for the unaliased images, coil sensitivities, and uncertainty are assessed from the a priori calibration image information. Images and coil sensitivities are jointly estimated a posteriori via the Iterated Conditional Modes algorithm and Markov chain Monte Carlo using Gibbs sampling. In addition, variability estimates and hypothesis testing is possible. This Bayesian SENSE (BSENSE) model utilizes prior image information to reconstruct images from the posterior distribution and is applied to simulated fMRI data. This BSENSE model produced a cleaner, less noisy reconstructed image compared to SENSE, meaning a clearer distinction between the different brain matter. It also performed better in capturing the increased signal from the task activation and decreased the correlation between aliased voxels over time. This simulated experiment was performed on a single slice non-task image, a series of non-task images, and a single slice image with task activation.
ComBat harmonization: Empirical Bayes versus fully Bayes approaches
Maxwell Reynolds, University of Pittsburgh
with Tigmanshu Chaudhary, Mahbaneh Eshaghzadeh Torbati, Dana L Tudorascu, and Kayhan Batmanghelich
Although large medical imaging datasets have enabled more powerful studies of diseases and biological processes, these datasets usually contain images acquired from several different sites and scanners. Different scanners produce slightly different image characteristics that can bias datasets and lead to less accurate and generalizable modeling if scanner-induced patterns are assumed to be neurological characteristics of a population. Harmonization, or correction for scanner differences, alleviates this issue to produce stable, biologically-based conclusions. A popular approach to harmonization called ComBat uses the empirical Bayes method for modeling scanner effects. We explore a hierarchical fully Bayesian alternative model for scanner effects on imaging features, which we find can be used for improved harmonization compared to popular empirical Bayes methods based on successful removal of scanner-relevant information and retention of biological information in the Alzheimer’s Disease Neuroimaging Initiative (ADNI) dataset. Empirical Bayes harmonization methods, while often providing valid point estimates, tend to underestimate uncertainty. Our fully Bayesian approach generates a rich posterior distribution, which is also useful for generating simulated imaging features for improving classifier performance in a limited data setting. We show the generative capacity of our model for augmenting and improving the detection of patients with Alzheimer’s disease. Posterior distributions for harmonized imaging measures can also be used for brain-wide uncertainty comparison and more principled downstream statistical analysis. Fully Bayesian (FB) ComBat should be considered when analyzing image-derived features from multiple sites or scanners.
A robust outlier detection approach for scrubbing artifacts in fMRI
Fatma Parlak, Indiana University
with Amanda F. Mejia
Functional magnetic resonance imaging (fMRI) data can be artificially contaminated due to both participant and hardware related reasons. In fMRI based studies, it is therefore necessary to identify artifactual volumes. These are often excluded from analysis, a procedure known as “scrubbing” or “censoring.” Such volumes contain abnormal signal intensities and can be thought of as multivariate outliers in statistical terminology. There exist many outlier-detection approaches for multivariate data and for fMRI data specifically. However, these methods either are non-robust or do not use a statistically principled approach to thresholding. Robust distance (RD) approaches that are adopted from Mahalanobis distance are promising but depend on assumptions of Gaussianity and independence, which we observe to be clearly violated in the fMRI context. When these assumptions are violated, the distribution of these RDs are unknown, preventing us from obtaining a quantile-based threshold for outliers. In this work, we develop a robust nonparametric bootstrap procedure to estimate an upper quantile of the distribution of RDs, which serves as the threshold for outliers. We compare the performance of our RD-based approach with existing “scrubbing” approaches for fMRI data, employing 5 resting-state fMRI sessions with high levels of artifacts from the Human Connectome Project.
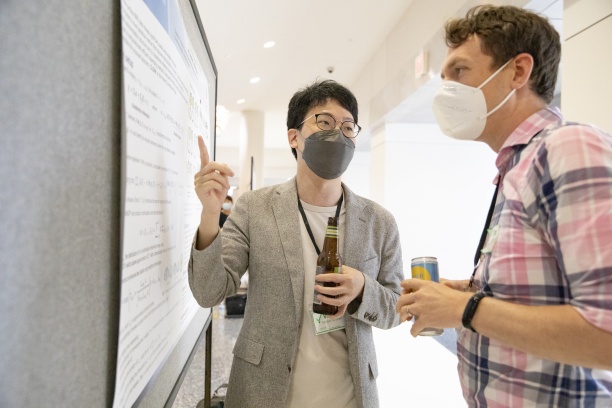
CLEAN: Leveraging spatial autocorrelation in neuroimaging data in clusterwise inference
Jun Young Park, University of Toronto
with Mark Fiecas
While clusterwise inference is a popular approach in neuroimaging that improves sensitivity, current methods do not account for explicit spatial autocorrelations because most use univariate test statistics to construct cluster-extent statistics. Failure to account for such dependencies could result in decreased reproducibility. To address methodological and computational challenges, we propose a new powerful and fast statistical method called CLEAN (Clusterwise inference LEveraging spatial Autocorrelations in Neuroimaging). CLEAN computes multivariate test statistics by modelling brain-wise spatial autocorrelations, constructs cluster-extent test statistics, and applies a refitting-free resampling approach to control false positives. We validate CLEAN using simulations and applications to the Human Connectome Project. This novel method provides a new direction in neuroimaging that paces with advances in high-resolution MRI data, which contains a substantial amount of spatial autocorrelation.
SPARTIN: A Bayesian method for the quantification and characterization of immune cell infiltration in spatial pathology imaging data
Nate Osher, University of Michigan
with Veerabhadran Baladandayuthapani and Jian Kang
Virtual session only
The large and ever-increasing volume of readily available pathological imaging data has sparked an interest in the development of methods to investigate spatial features present in this data. One such feature of interest is immune cell infiltration. In order to better assess immune cell infiltration at the biopsy level we have developed the SPARTIN (SPatial Analysis of paRtitioned Tumor-Immune imagiNg) pipeline. After applying this pipeline to spatial imaging data from skin cutaneous melanoma to compute biopsy-level cell type interaction probabilities (CTIP), we found that CTIP was associated with the prevalence of specific types of immune cells in the tumor microenvironment as well as pathologist assessment of lymphocyte infiltration. In addition, we found that CTIP was significantly negatively associated with overall survival.
KCBC: A correlation-based method for colocalization analysis using bivariate Ripley's K functions
Xueyan Liu, University of New Orleans
with Stephan Cobby Komladzei
Motivated by the high demand of colocalization analysis methods in recent literature for single-molecule microscopy images which are featured with precise locational information of molecules at the nanometer scales, we use the bivariate Ripley's K function and develop a correlation-based method, KCBC, named after the Coordinate-Based Colocalization (CBC) method proposed by Malkusch in 2012. The local KCBC values are to quantify the local spatial colocalization of events between two species by measuring the correlation of bivariate Ripley's K functions over equal area concentric rings around the base species. The mean of local KCBC values is proposed to quantify the colocalization degree of cross-channel events to base-channel events for the whole image. It could effectively correct the false positives with reduced variance within the user-defined largest observation distance. Extensive simulations are conducted and discussed. Real data applications are provided to illustrate the applicability of our methods.
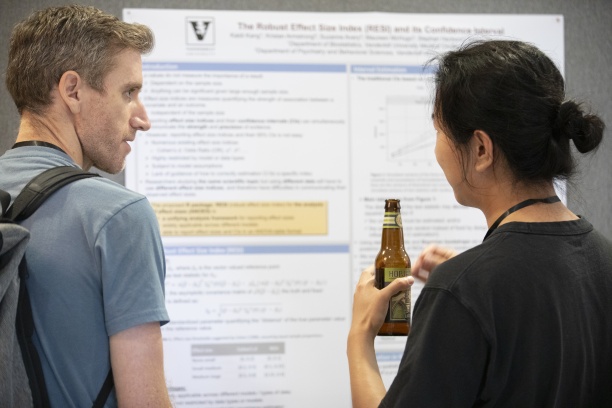
Accurate confidence interval estimation for non-centrality parameters and effect size indices
Kaidi Kang, Vanderbilt University
with Kristan Armstrong, Suzanne Avery, Maureen McHugo, Stephan Heckers, and Simon Vandekar
Effect size indices are useful tools for communicating study findings. Reporting effect size index estimates with their confidence intervals (CIs) can be an excellent way to simultaneously communicate the strength and precision of the observed evidence. We recently proposed a robust effect size index (RESI) that is advantageous over common indices because it’s widely applicable to different types of data. In this research, we use statistical theory and simulations to develop and evaluate RESI estimators and CIs that rely on different covariance estimators. Our results show that (1) counter to intuition, the randomness of covariates reduces coverage for Chi-square and F CIs; and (2) when the variance of the estimators is estimated, the non-central Chi-square and F CIs using the parametric and robust RESI estimators fail to cover the true effect size at the nominal level. Using the robust estimator along with the proposed bootstrap CI provides valid inference for the RESI, especially when model assumptions may be violated. We also aim at utilizing our approach in the construction of confidence sets in neuroimaging.
Causal modeling with applications to MRI biomarkers in multiple sclerosis
S. Hurtado Rúa, Cleveland State University
with Susan Gauthier
We implement a methodology to jointly model time-to-event and longitudinal data. In particular, we analyze the risk of disability in multiple sclerosis (MS) patients with time-varying magnetic resonance imaging (MRI) quantitative measurements. In a simulation study, we compare model estimates obtained from Bayesian, joint likelihood (longitudinal and time-to-event variables), and two-stage approaches. We also estimate patient-specific longitudinal MRI feature’s trajectory and disability risk.
Leveraging principal component analysis to study intermodal coupling in two or more modalities
Fengling Hu, University of Pennsylvania
with Sarah M. Weinstein, Erica B. Baller, Alessandra M. Valcarcel, Azeez Adebimpe, Armin Raznahan, David R. Roalf, Timothy Robert-Fitzgerald, Virgilio Gonzenbach, Ruben C. Gur, Raquel E. Gur, Simon Vandekar, John A. Detre, Kristin A. Linn, Aaron Alexander-Bloch, Theodore D. Satterthwaite, and Russell T. Shinohara
There is increased availability of multi-modal scans for individual subjects, with each modality containing specific information about brain structure or function. While analysis of each modality independently is widely conducted, previous studies have shown that the additional information in the local covariance structures between modalities, or intermodal coupling (IMCo), is often complementary and may unveil otherwise undetectable findings.
However, available methods for studying these local covariance structures are based on regression, which is inherently asymmetric – that is, coupling depends on the order modalities are listed – and only defined for two modalities. Here, we present a method of describing this covariance structure for two or more modalities at the voxel level based on local covariance decompositions. We apply this technique in a large neurodevelopmental cohort and find that intermodal coupling offers a promising perspective for unveiling otherwise undetected localized underlying relationships when analyzing studies involving multiple imaging modalities.
Translating high-dimensional statistical testing to improve batch effect detection in radiomic studies
Hannah Horng, University of Pennsylvania
with Despina Kontos and Russell T. Shinohara
Radiomic features have been shown to have a wide range of clinical applications, but variability due to image acquisition factors (“batch effects”) can affect the reproducibility and generalizability of predictive models built on radiomic features. There are no standardized pipelines for the detection of batch effects associated with known imaging parameters, and the statistical tests used are not suited for the non-Gaussian distributions often found in radiomic features. In this work, we translate the PERMANOVA statistical test to improve batch effect detection in non-Gaussian imaging data and demonstrate its improved performance in simulated datasets emulating common scenarios in radiomic features. These scenarios include large sample sizes, bimodal feature distributions, and confounding between biological and technical variables.
Connectivity regression
Neel Desai, University of Pennsylvania
with Veera Baladandayuthapani and Jeffrey S. Morris
One key scientific problem in neuroscience involves assessing how functional connectivity networks in the brain vary across individuals and subject-specific covariates. In this poster we introduce a general regression framework for regressing subject-specific connectivity networks on covariates while accounting for inter-edge dependence within the network. Our approach utilizes a matrix-logarithm function to transform the network object into an alternative space in which Gaussian assumptions are justified and positive semidefinite constraints are automatically satisfied. Multivariate regression models are fit in this transformed space, with the covariance accounting for inter-edge network dependence and multivariate penalization used to induce sparsity in regression coefficients and covariance elements. We use permutation tests to perform multiplicity-adjusted inference to identify which covariates affect connectivity, and stability selection scores to indicate which network circuits vary by covariate. Simulation studies validate the inferential properties of our proposed method and demonstrate how estimating and accounting for inter-edge dependence when present leads to more efficient estimation, more powerful inference, and more accurate selection of which network circuits vary by covariates. We apply our method to data from the Human Connectome Project (HCP) Young Adult study, revealing insights into how connectivity varies across language processing covariates and structural brain features.
Confidence regions for the location of peaks of a smooth random field
Samuel Davenport, University of California San Diego
with Armin Schwartzman and Thomas E. Nichols
In this work we provide confidence regions for the location of peaks of the mean given multiple realisations of a random process. We prove central limit theorems for the location of the maximum of mean random fields and use these to provide asymptotic confidence regions for peak mean. Under the assumption of stationarity we develop Monte Carlo confidence regions for peaks of the mean that have a better finite sample coverage than the ones that are derived based on classical asymptotic normality. In the neuroimaging setting this can be used to determine where the highest peaks of activation in an imaging study are most likely to lie.
Statistical evaluation of an image analysis algorithm trained to detect and score rodent cardiomyopathy
Caroll A. Co, Social & Scientific Systems
with Sandra McBride, Shawn Harris, Debra A. Tokarz, Thomas J. Steinbach, and Keith R. Shockley
Virtual session only
Advances in whole slide imaging and artificial intelligence (AI) have created opportunities for quantitative pathological assessments, improving classification and reducing errors in detection. In rodent cardiotoxicology studies, microscopic evaluation of rodent hearts is commonly performed to detect and grade the severity of histopathologic changes due to test article exposure. These changes can mimic or be masked by a background change of progressive cardiomyopathy (PCM) so it is imperative to quantify the amount of PCM present in treated and control animals. PCM can be characterized by quantifying the severity of fibrosis, necrosis, mononuclear cell infiltration and/or mineralization in the heart. Although there is standard diagnostic criteria for semi-quantitative human-grading of PCM published in the literature, challenges remain in the consistency of grading across pathologists and across studies. The use of a trained computer-assisted image analysis algorithm can help provide objectivity and consistency in quantifying the severity of PCM. Our aim was to use a statistical model to test the performance of a trained AI algorithm on a set of 300 heart slides that the algorithm has not seen before. We used a multinomial logistic regression model to evaluate the performance of the AI algorithm when compared to the severity grading reached by a multi-center panel of five veterinary pathologists. We found a positive strong correlation between the total percentage of heart area affected and the pathologists’ median severity grade, suggesting that AI can be a useful tool in the diagnosis of PCM.
LaxKAT: A more powerful method to test for association and localize signal in high-dimensional data
Christina Chen, University of Pennsylvania
with Jeremy Rubin, Lior Rennert, Mackenzie Edmondson, Simon Vandekar, and Russell T. Shinohara
The sequence kernel association test (SKAT) is a widely used and effective method in imaging studies. However, the omnibus nature of the test makes interpretation difficult. We have developed a new method called LaxKAT that tests for association and localizes signal in high-dimensional data. The LaxKAT statistic maximizes the SKAT statistic over a pre-specified subspace of linear kernels. We apply our method to neuroimaging data and demonstrate via simulations that it exhibits improved power compared to previous methods while controlling the Type I error rate.
Similarity-based multimodal regression
Andrew Chen, University of Pennsylvania
with Sarah M. Weinstein, Azeez Adebimpe, Kathleen Ries Merikangas, Theodore D. Satterthwaite, Russell T. Shinohara, and Haochang Shou
To better understand complex human phenotypes, large-scale studies have increasingly collected multiple data modalities across domains such as imaging, mobile health, and physical activity. The properties of each data type often differ substantially and require either separate analyses or extensive processing to obtain comparable features for a combined analysis. Multimodal data fusion enables certain analyses on matrix-valued and vector-valued data, but generally cannot integrate modalities of different dimensions and data structures. For a single data modality, multivariate distance matrix regression provides a distance-based framework for regression accommodating a wide range of data types. However, no distance-based method exists to handle multiple complementary types of data. We propose a novel distance-based regression model, which we refer to as Similarity-based Multimodal Regression (SiMMR), that enables simultaneous regression of multiple modalities through their distance profiles. We demonstrate through simulation, imaging studies, and longitudinal mobile health analyses that our proposed method can detect associations in multimodal data of differing properties and dimensionalities, even with modest sample sizes. We perform experiments to evaluate several different test statistics and provide recommendations for applying our method across a broad range of scenarios.
Deep neural network classifier for multi-dimensional functional data
Guanqun Cao, Auburn University
with Shuoyang Wang and Zuofeng Shang
We propose a new approach, called a functional deep neural network (FDNN), for classifying functional data—specifically, a deep neural network based on the principal components of the training data, which are used to predict the class label of a future data function. Unlike the popular functional discriminant analysis approaches which rely on Gaussian assumption, the proposed FDNN approach applies to general non-Gaussian multi-dimensional functional data. Moreover, when the log density ratio possesses a locally connected functional modular structure, we show that FDNN achieves minimax optimality. The superiority of our approach is demonstrated through both simulated and real-world datasets.
BOSS: Beta-mixture unsupervised Oligodendrocytes Segmentation System
Eunchan Bae, University of Pennsylvania
with Russell T. Shinohara and Jennifer L. Orthmann-Murphy
To develop reparative therapies for multiple sclerosis (MS), we need to better understand the physiology of loss and replacement of oligodendrocytes, the cells that make myelin and the target of damage in MS. In vivo two-photon fluorescence microscopy allows direct visualization of oligodendrocytes in transgenic mouse models and promises a deeper understanding of the longitudinal dynamics of replacing oligodendrocytes after damage. However, the task of tracking oligodendrocytes requires extensive human effort and is especially challenging in three-dimensional images. While several models exist for automatically annotating cells in two-dimensional images, few models exist to annotate cells in three-dimensional images, and even fewer are designed for tracking cells in longitudinal imaging. Furthermore, the complexity of processes and myelin formed by individual oligodendrocytes can result in the failure of algorithms that are specifically designed for tracking cell bodies alone. Here, we propose a novel beta-mixture unsupervised oligodendrocyte segmentation system (BOSS) that can segment and track oligodendrocytes in three-dimensional images over time and requires minimal human input. We evaluated the performance of the BOSS model on a set of eight images obtained longitudinally. We show that the BOSS model can segment and track oligodendrocytes similarly to a blinded human observer.
Go to the schedule page • the list of instructors and speakers • the conference homepage
The virtual poster session took place on Wednesday, May 18, from 4:00 to 7:00 p.m. Central Time on Gathertown.

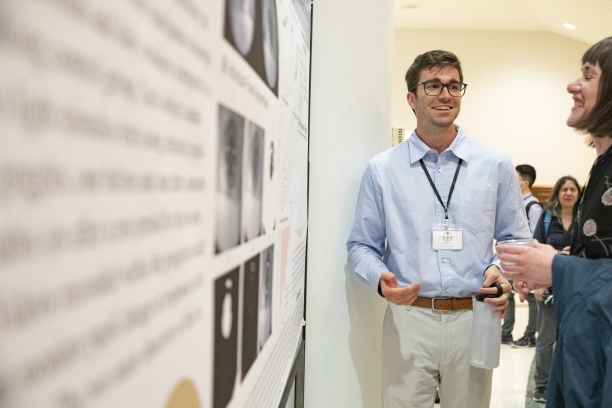
Vanderbilt Biostatistics PhD candidate Kaidi Kang in conversation about his poster.

Michigan Biostatistics PhD candidate Nate Osher fielding comments about his poster from Simon Vandekar and others.
Photo: Susan Urmy / Vanderbilt University Medical Center