The instructions below detail how to download RSS series data and then use a pivot table in excel to aggregate attendance reports from CloudCME in order to automatically count by learners and/or date/session. Note that depending on your version of Excel, and whether you use a Mac or PC, your screen may look a little different than the screenshots below. The pivot table will be the same, however.
Download Data
- Reports
- Credits
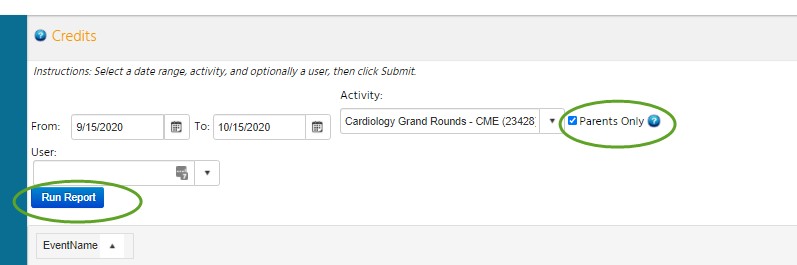
- Select the desired date range, click the Parents Only, then type your series name in the Activity box until it appears. Click its title when it does
- Run Report
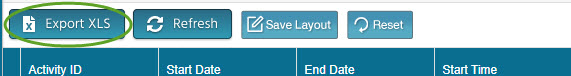
- Export XLS to download
Count in Excel (pivot table)
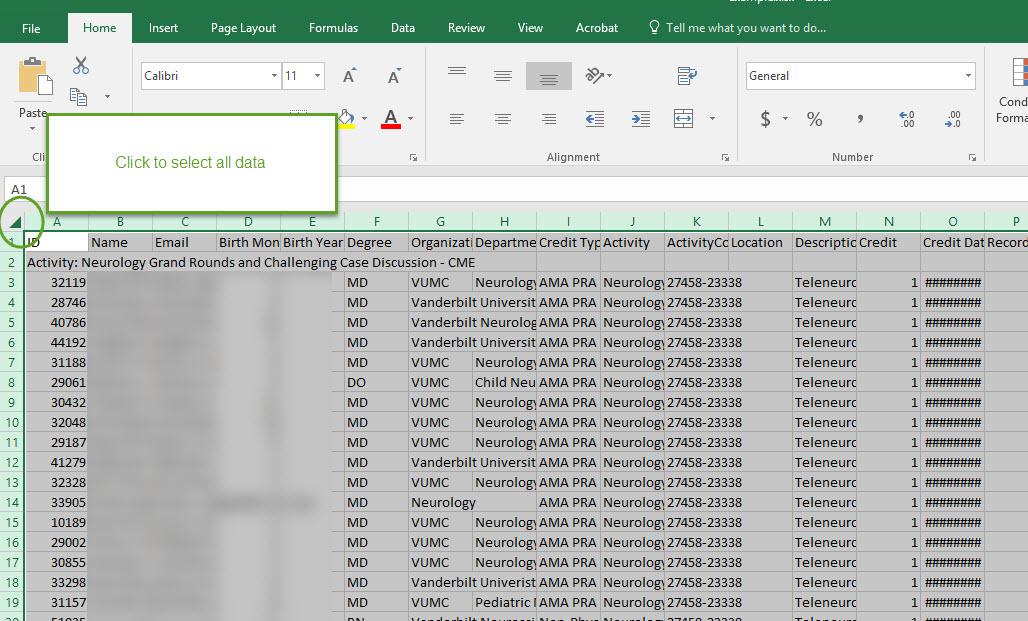
- Open your file in excel
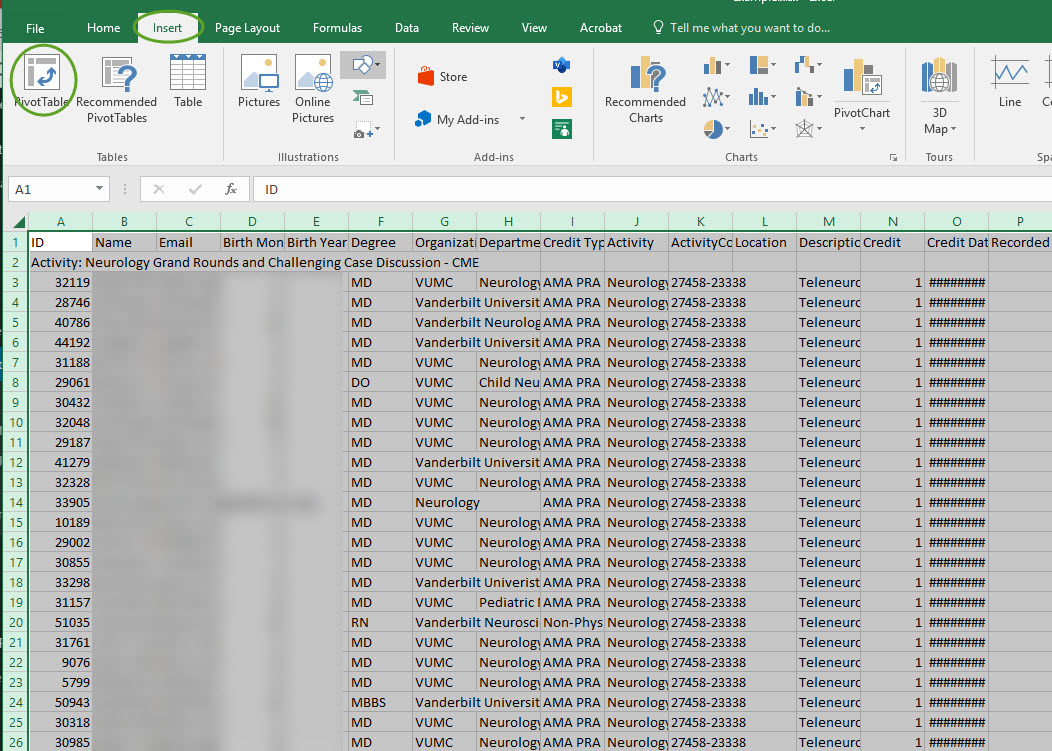
- Select all data
- Insert then PivotTable
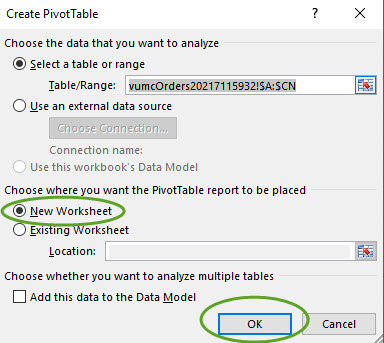
- Make sure it is placed in a new worksheet, then OK (the range is automatically selected and does not need to be changed)
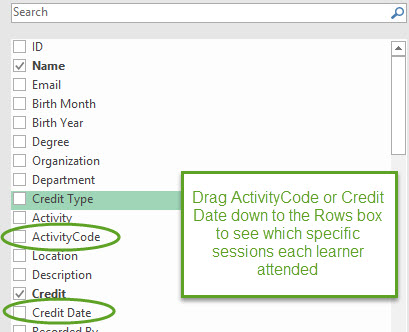
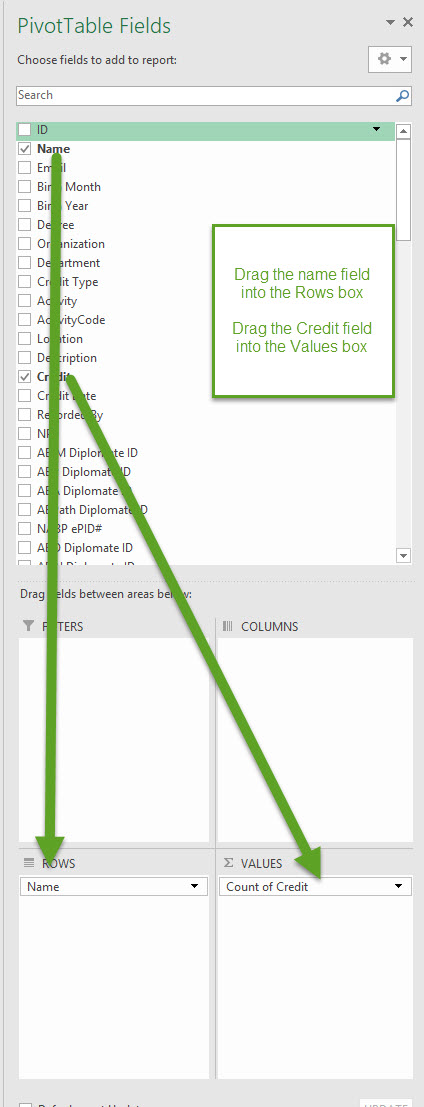
- Click on the PivotTable to open the menu on the right side. Drag the Name field down into the Rows box. Drag the Credits field down into the Values box.
- Optional: