-
Since the PhenoCycler microscope requires sections to be adhered to positively-charged 22 x 22 mm coverslips, the ITR will prepare sections for projects, unless the investigator requests to prepare the sections in their lab or elsewhere. We ask that the investigator provide embedded tissue that will ideally fit onto a 15.2 x 15.2 mm area of the coverslip. For details, please see the “PhenoCycler Sample Requirements” portion of our website and contact us if you have questions.
-
Pre-conjugated antibodies are available from Akoya Biosciences, and unconjugated antibodies can be barcode conjugated in-house. When proteins of interest have been identified, a preliminary antibody panel will be prepared based on theoretical barcode and marker compatibility. If you are unsure about your target proteins, the ITR can work with you to determine the markers for your cell populations of interest.
Typically, we need to optimize antibodies on the investigator’s tissue of interest during multiple staining and imaging sessions. Antibodies will be titrated for obtaining the best signal-to-noise ratio. Markers that are imaged simultaneously within one cycle need to be compatible with each other, and all markers need to be placed in an optimized imaging order. At this step, we may also incorporate a tissue autofluorescence quenching protocol. Staining patterns are compared to single marker chromogenic IHC to ensure assay performance. Specialized attention is required for in-house conjugated antibodies because we need to verify that the antibodies’ original staining pattern, evaluated by chromogenic IHC, has not been altered by the conjugation process.
To assess our results, our team has recruited a pathologist with years of experience in multiplexed immunofluorescence, Paula Gonzalez Ericsson, M.D., to work with us and evaluate images for quality and proper marker localization.
-
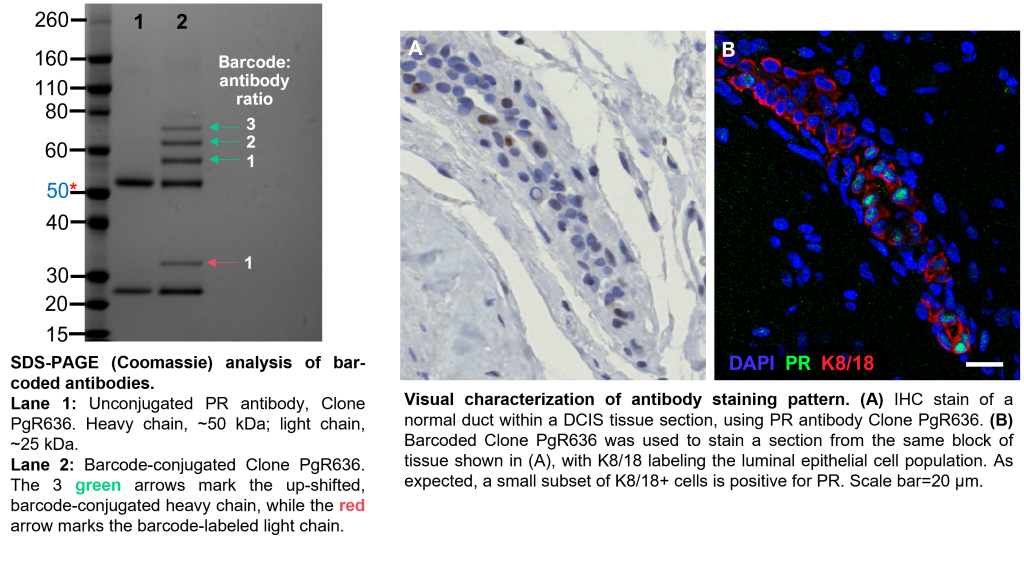
In case Akoya Biosciences does not offer a pre-conjugated antibody of interest in their catalog, we offer a barcode conjugation service. The chosen antibodies are required to be monoclonal, but there is no limitation on the host species. They can be commercial or provided by the investigator. Usually, the amount of purified antibody used in a conjugation reaction is 30-50 µg.
Activated barcodes which are compatible with the rest of the antibody panel will be purchased from Akoya Biosciences.
Following conjugation, some antibody clones may lose their specificity for their target. Therefore, in addition to verifying successful conjugation by SDS-PAGE, we also verify that the antibody’s staining pattern remains true.
-
Once panel development is finished, we will stain and image the investigator’s experimental samples. Please also see the “PhenoCycler (CODEX) Technology” section of our website for more details on each of these steps.
Tissue staining consists of applying the entire antibody panel onto tissue sections mounted on coverslips. Staining takes one day to finish.
PhenoCycler runs involve the set-up of a stained coverslip on the microscope stage, the preparation of its corresponding reporters, and the selection of regions of interest (ROIs) to be imaged.
Once initiated, the microscope and fluidics systems are fully automated and will continue to run until all reporters have been applied and their corresponding images have been captured. Depending on the number of markers in the panel and the size and number of ROIs, this automated process may require as few as 6 hours or as many as 48 hours to finish one coverslip. Particularly large antibody panels could take even longer. We do not charge investigators for the duration of time that the automated portion of the instrument is in use; rather, we want them to be aware of the potential turn-around times for their projects.
Image processing encompasses all file handling following the PhenoCycler run and the usage of Akoya Biosciences’ processor software to generate a final processed image with overlayed markers. Much like the PhenoCycler runs, the duration of time that image processing requires will depend on the ROI number and size, as well as the number of markers in the panel.
In total, staining, imaging, and processing one coverslip could require 2 to 5 days depending on panel and sample size.
-
After stained control tissues and samples of interest have been imaged and those images have been processed, the ITR will verify that all markers worked as intended and stained their relevant cell populations.
We strongly encourage investigators to collaborate with someone with multiplex histological imaging analysis experience. The ITR can offer image analysis supervised by our pathologist using automated algorithms, including: 1) cell segmentation, 2) phenotyping, and 3) spatial profiling.
Data output can range from simple to complex and can consist of: 1) single cell data table (including xy coordinates and protein of interest intensity measurements on each cell compartment), or 2) more in-depth analysis of cell-to-cell spatial relationships and neighborhoods.
If you are unsure about where to start, the ITR can work with you to determine the best approach to your data analysis.
Data Analysis Sample Workflow
(A-B) Images generated by the PhenoCycler
(A) DCIS tissue section, 2.75 x 2.82 mm field of view, stained with a 22-antibody panel; Pan-Cytokeratin and CD45 are displayed. Scale bar = 250 µm.
(B) Inset of (A), providing cellular detail for the selected region. Scale bar = 100 µm.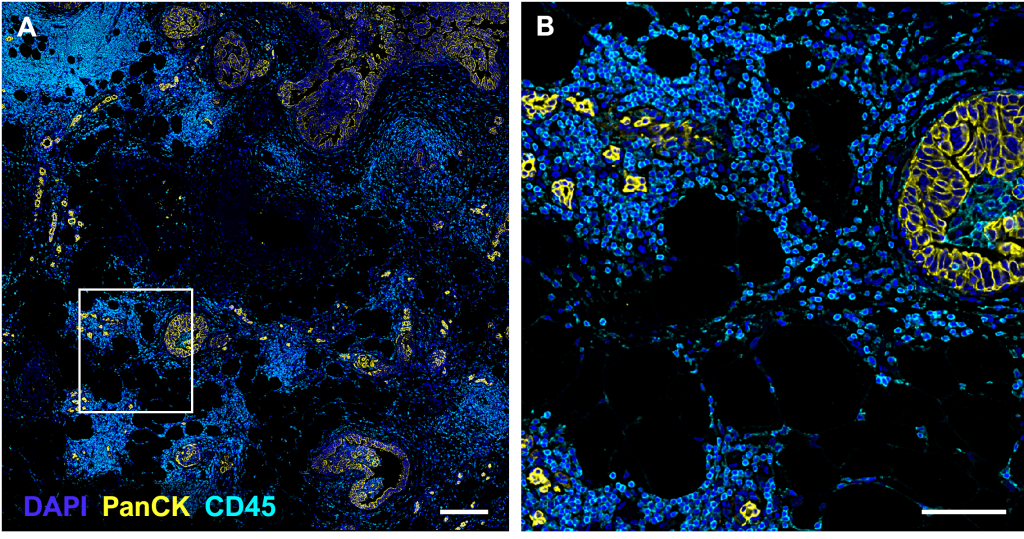
(C-D) Cell segmentation
(C) A deep learning segmentation algorithm (QuPath software) was performed on DAPI in the tissue depicted in (A), resulting in a red mask which contours the boundaries of each nucleus and serves as the basis for defining individual cells.
(D) Inset of (C), corresponding to the field of view in (B).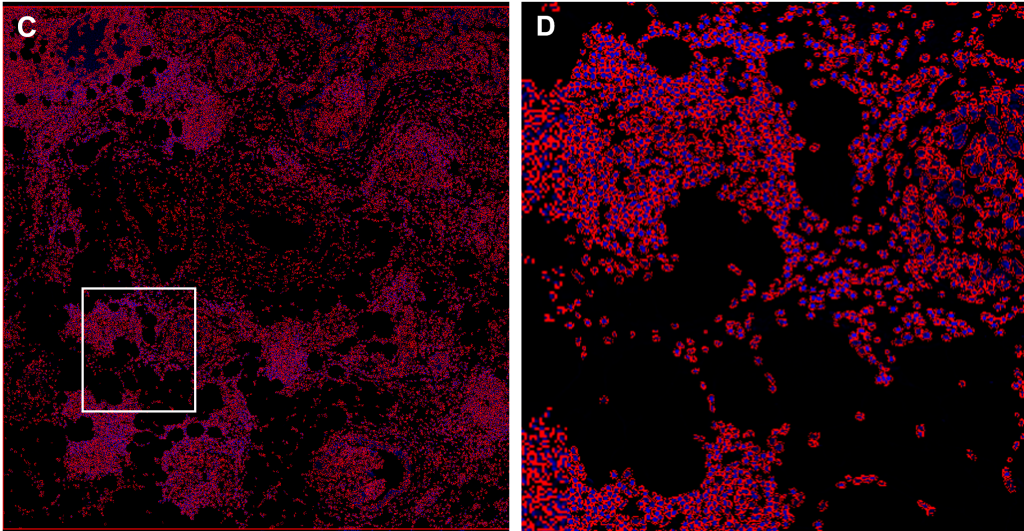
(E-H) Cell phenotyping
Cell phenotyping can be performed by gating, machine learning algorithms, or clustering (QuPath and/or CytoMAP software).
In this example, CK and CD45 expression were gated to first define epithelial (E,F) and immune cell (G,H) populations.
Utilizing selected relevant markers from the antibody panel, cell phenotypes were defined within each population by cell clustering (E-H), supervised by Dr Gonzalez Ericsson.
(E) Epithelial cell populations, color-coded as indicated in the legend.
(F) Inset of (E), corresponding to the field of view in (B).
(G) Immune cell populations, color-coded as indicated in the legend.
(H) Inset of (G), corresponding to the field of view in (B).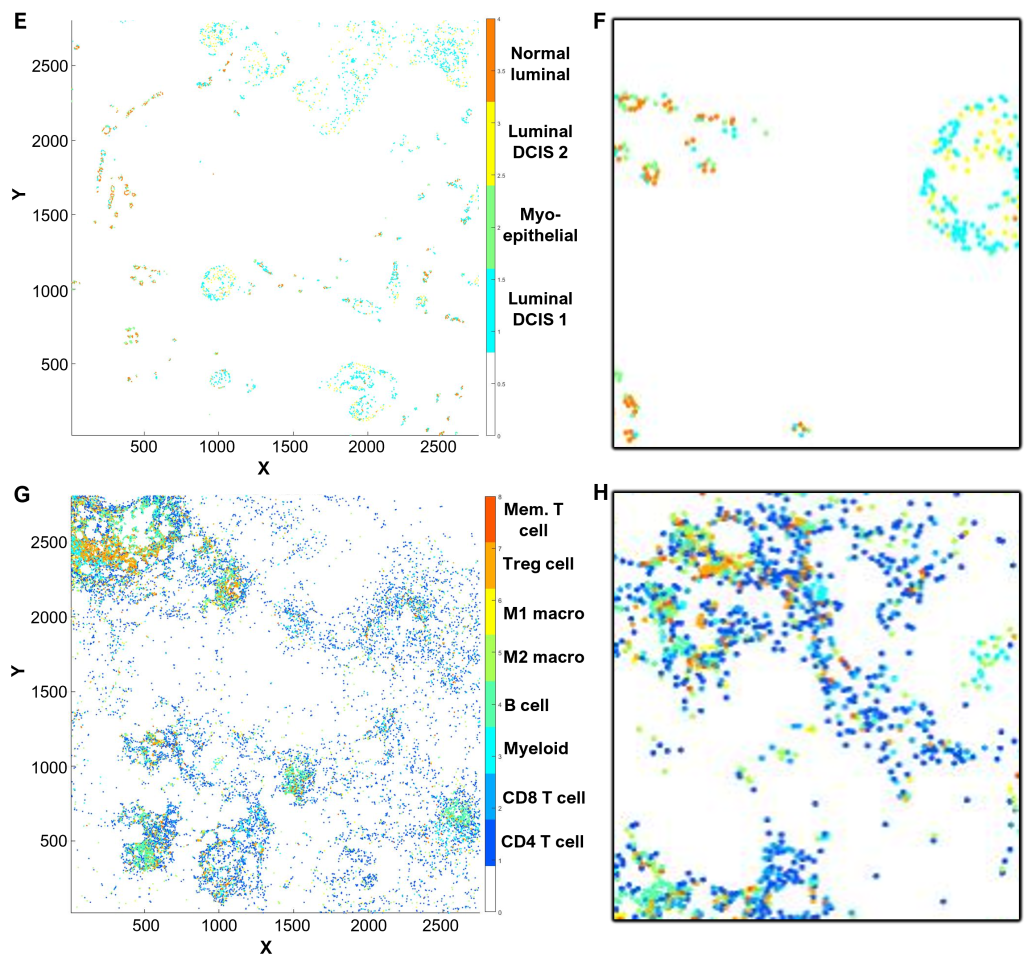
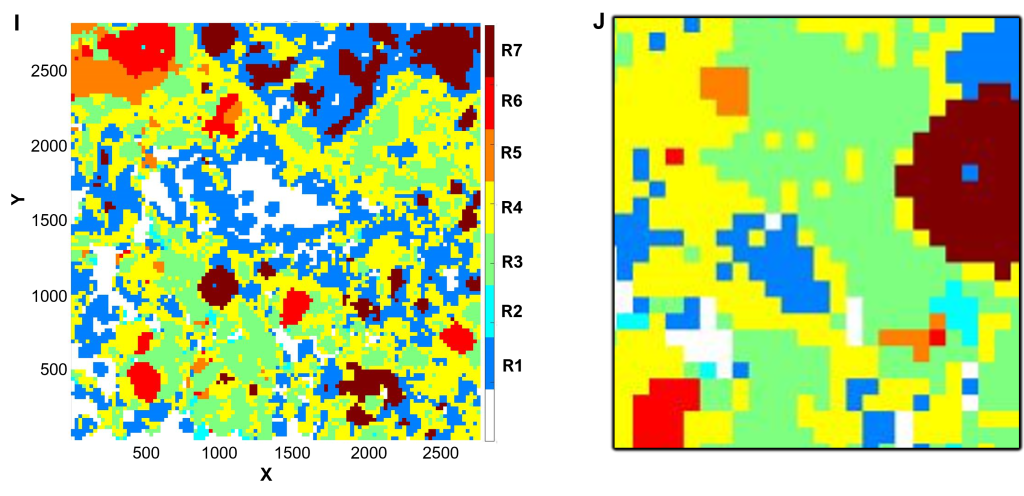
(I-J) Spatial profiling
Using CytoMAP software, cell phenotypes were further clustered according to xy coordinate location to define neighborhoods.
(I) DCIS in maroon (R7) is surrounded by immune cold micro-environment in blue (R1) separate form tertiary lymphoid structures in red (R6), orange (R5), and green (R3).
(J) Inset of (I), corresponding to the field of view in (B).