PhenoCycler (CODEX) Technology
PhenoCycler Technology
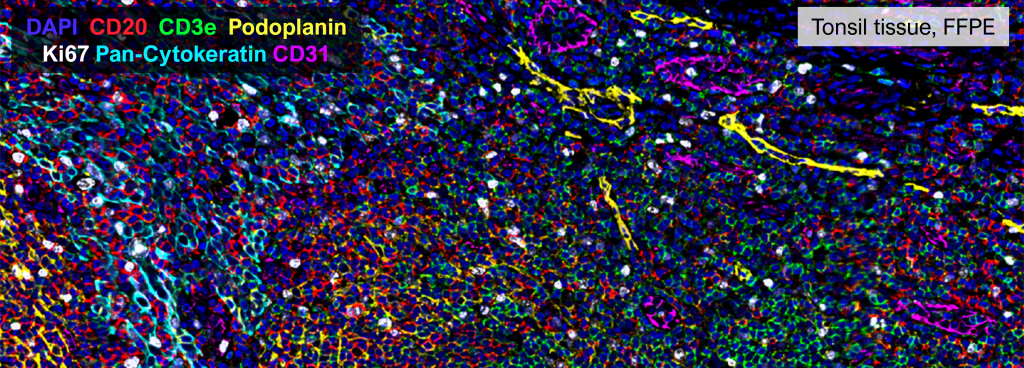
CO-Detection by indexing (CODEX) technology (PhenoCycler) allows for highly-multiplexed immunofluorescence (40+ markers) on formalin-fixed paraffin embedded (FFPE) or fresh frozen tissues. Thus, this system offers a high-dimensional cellular analytic platform that can capture tissue architecture with pertinent cellular components and phenotypic changes at a single cell resolution.
PhenoCycler Antibodies
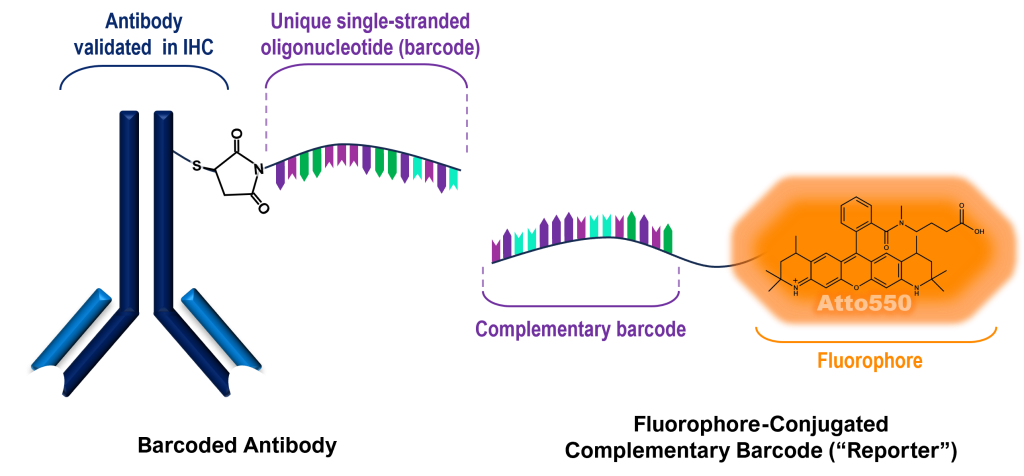
CODEX technology, as utilized by the Akoya Biosciences PhenoCycler system, relies on two major components:
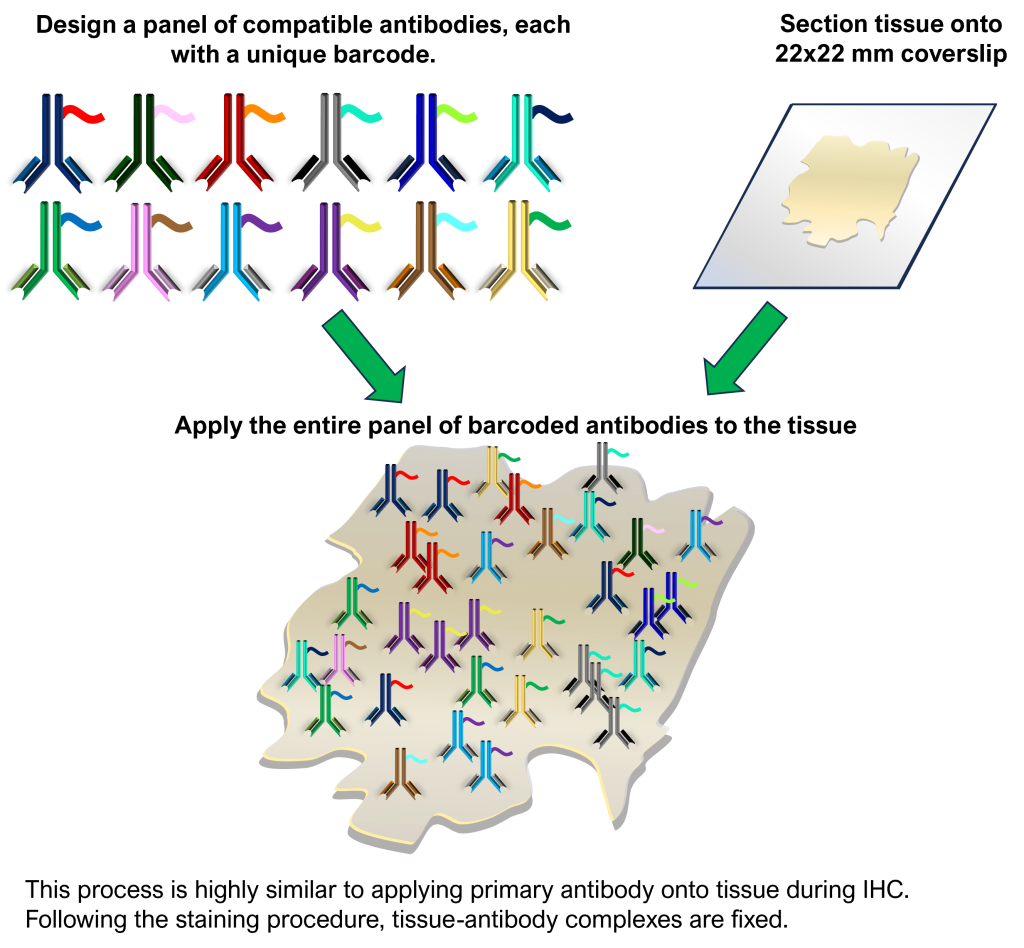
Barcoded antibodies: Monoclonal antibodies that are conjugated with uniquely designed single-stranded oligonucleotides (barcodes)
Reporters: Complementary oligonucleotides/barcodes which are conjugated to fluorophores
These highly specific antibody-reporter pairings allow for the visualization of more than 40 proteins of interest (“markers”) within the same tissue section (FFPE or fresh frozen).
Pre-conjugated antibodies and their respective reporters are provided by Akoya Biosciences and can be found online: https://www.akoyabio.com/phenocycler/assays/
When pre-conjugated antibodies are not available, the ITR can custom conjugate monoclonal antibodies to barcodes and incorporate them into your panel. We recommend that the chosen antibodies were validated for use in immunohistochemistry (IHC) by the vendor.
PhenoCycler Workflow
Tissue Staining
PhenoCycler Imaging Run
The stained tissue coverslip is set onto the microscope stage insert, which is connected to an automated fluidics system.
One “Cycle” of an imaging run consists of the following 3 steps: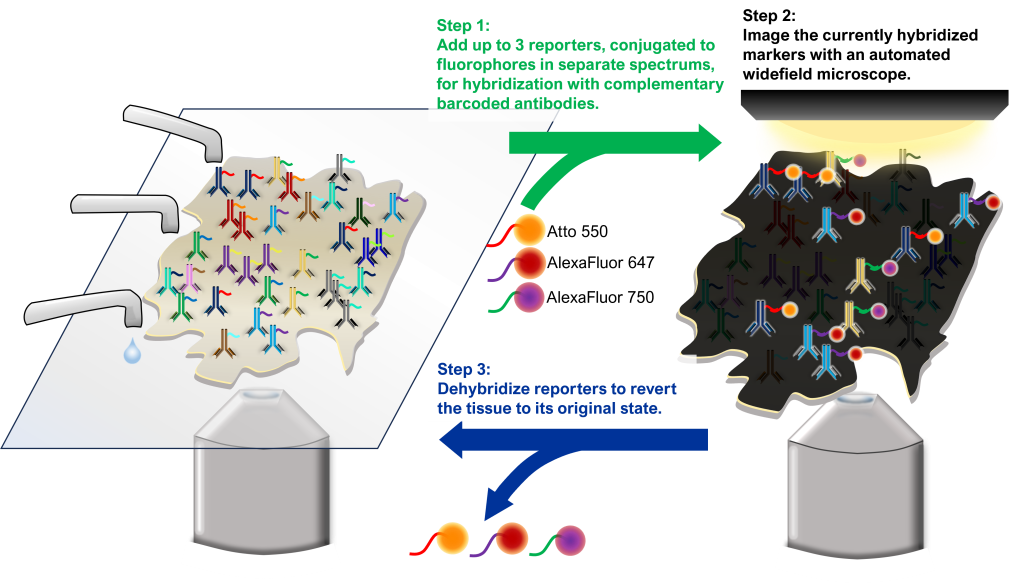
The above process is repeated with different sets of reporters until the entire antibody panel has been imaged.
The ITR has developed panels with up to 24 markers, imaged across 12 cycles. Panel development of up to 40 markers may be feasible. Please inquire for more details.
Image Processing
Akoya Biosciences provides processing software which manipulates the original images into a final file that contains all markers, with DAPI labeling the DNA of nucleated cells. The following are some noteworthy steps during processing:
Individual tiles (i.e., fields of view) are stitched together to form a large region of interest (ROI).
The largest ROI that the ITR has acquired measures 6.3 (X) by 5.86 (Y) mm.
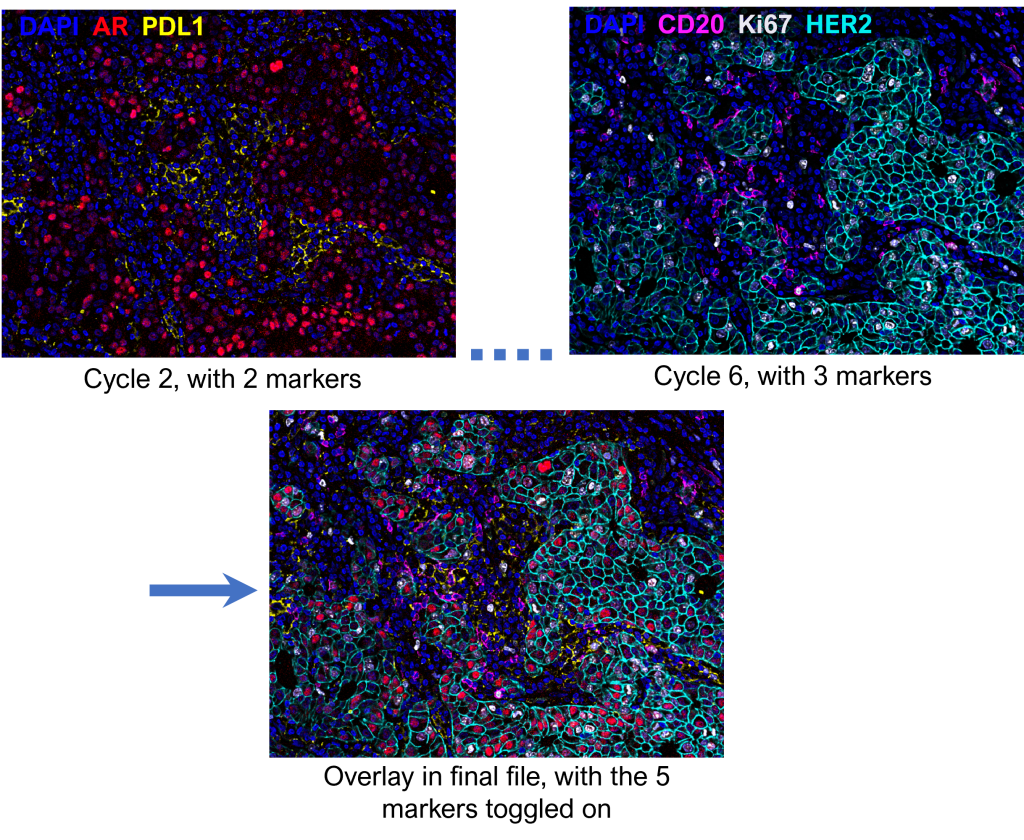
The processing software should be able to accommodate ROI’s up to 10 x 8 mm in size. Please consult us if large ROI’s are necessary for your project.The stitched images from each Cycle are overlaid to be part of one final file, in which marker visualization can be turned on and off.
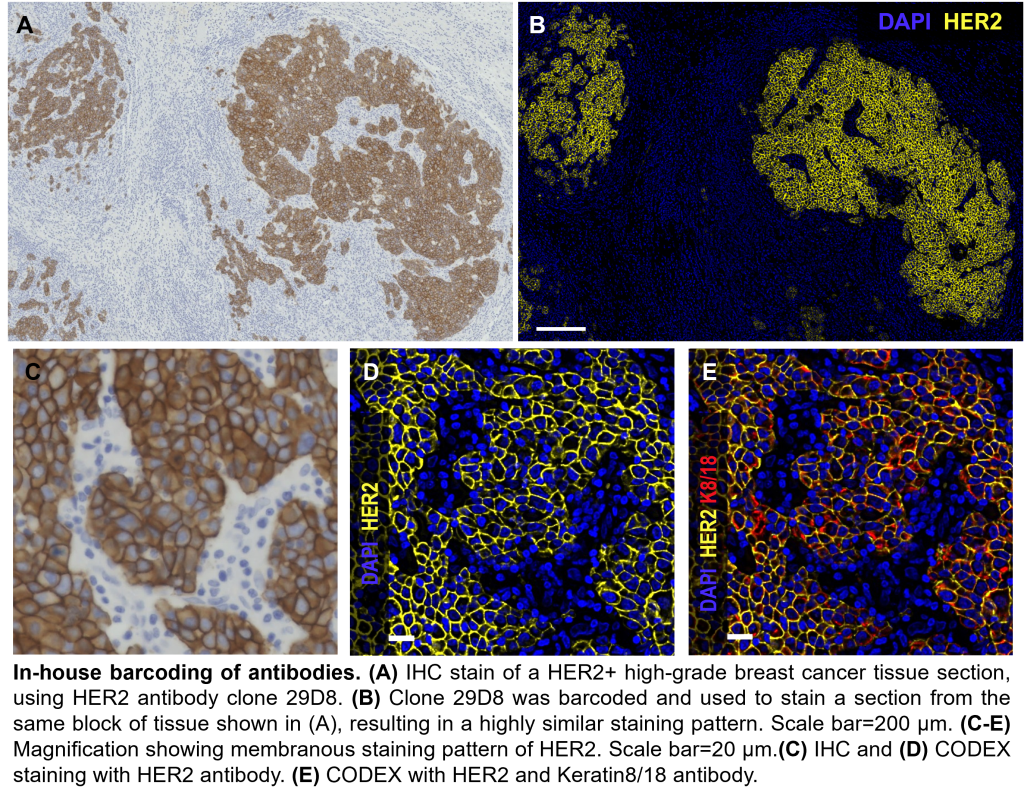
Example: