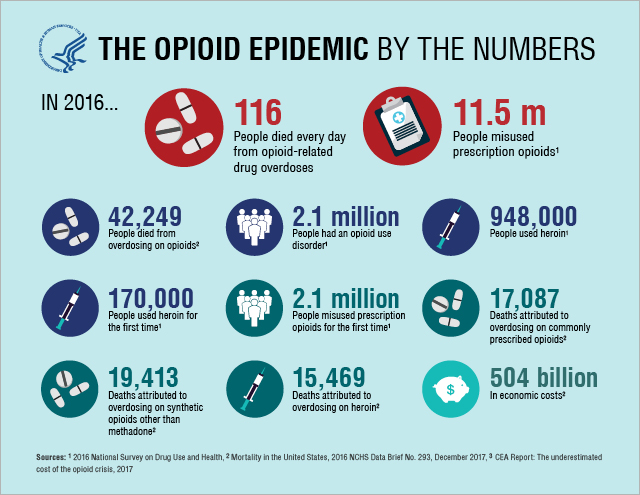


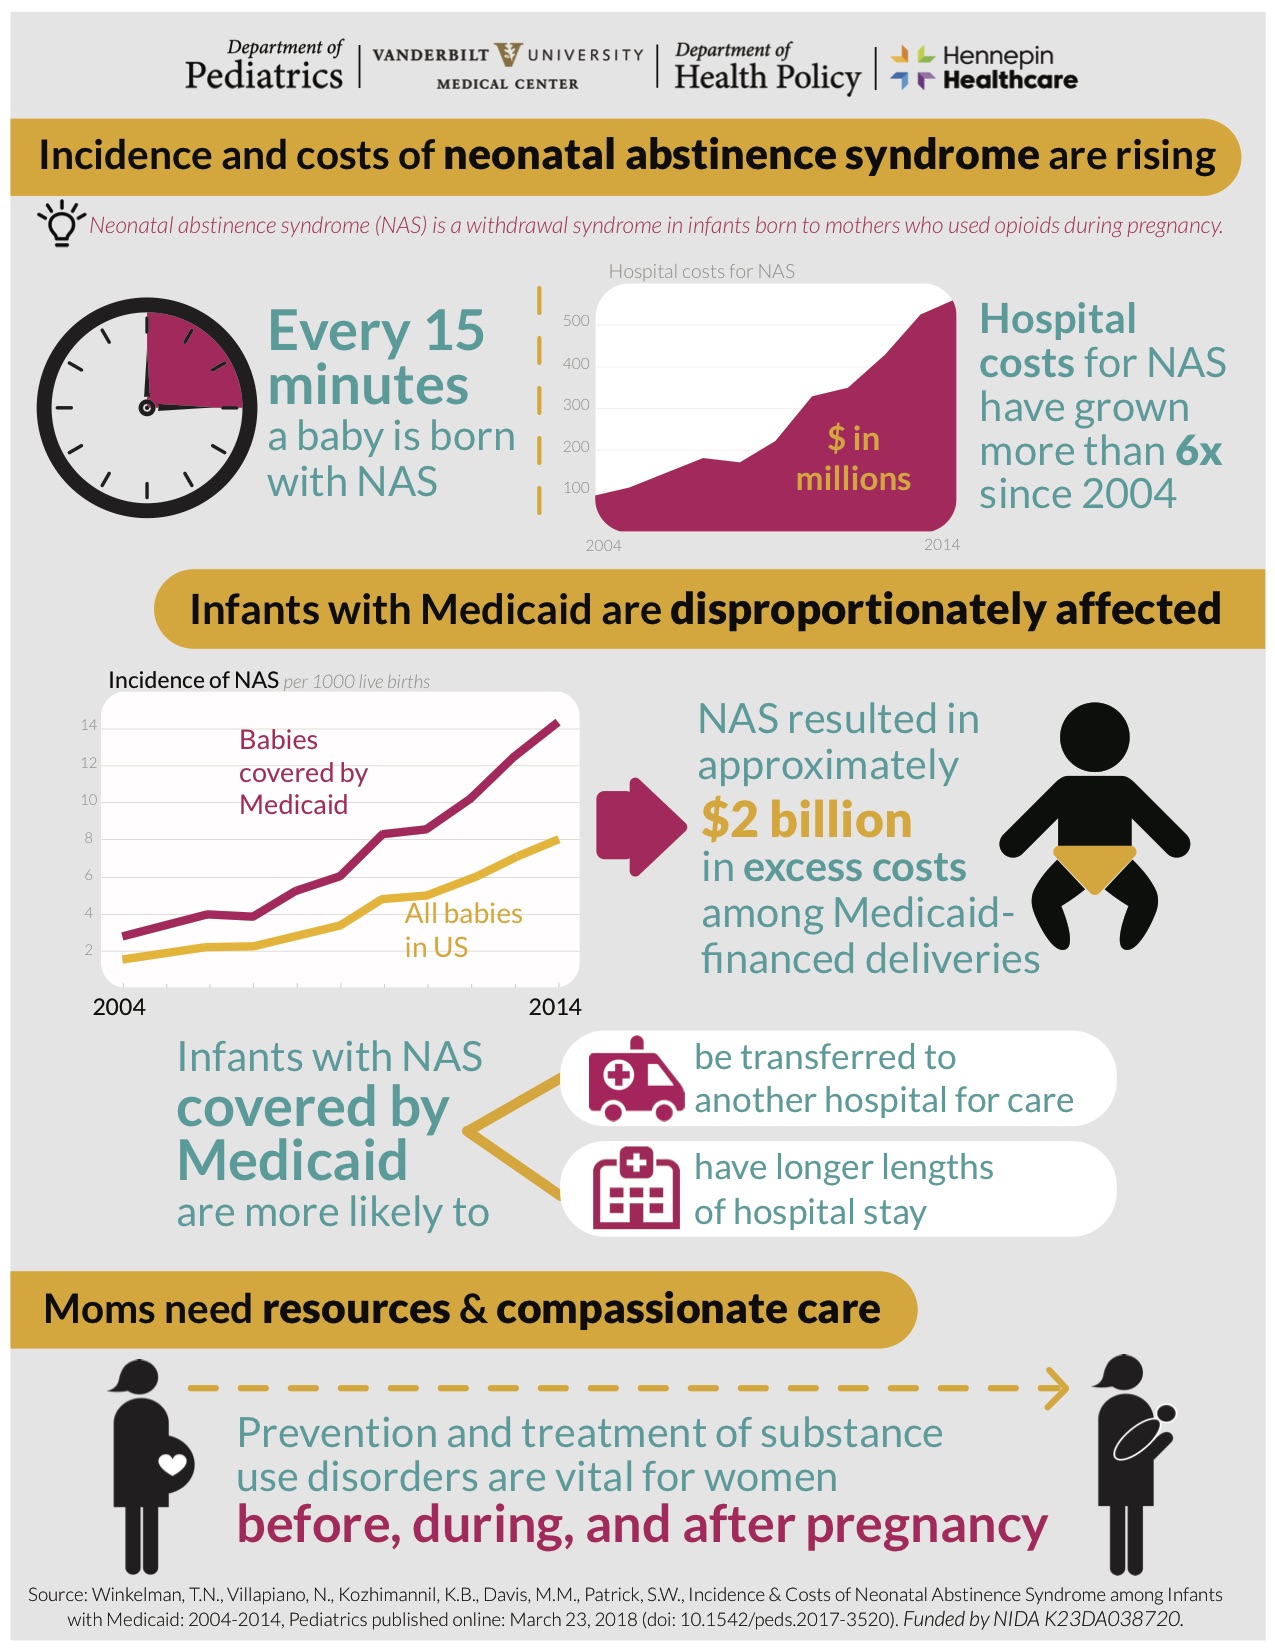
Neonatal abstinence syndrome (NAS) is a drug withdrawal syndrome that some experience infants shortly after birth. While withdrawal syndromes have been described after in utero exposure to several substances, opioids remain the most common exposure leading to NAS. Opioids are a broad class of drugs, which include legal prescriptions like oxycodone, and illicit drugs like heroin. Infants with NAS display a myriad of clinical signs, including breathing problems, feeding difficulties and rarely seizures. Recently, NAS became more common in communities in the US as use of prescription opioids grew rapidly. The complexity of the opioid epidemic itself requires a multi-disciplinary approach focused on improving clinical care, research and outreach to the public.
-
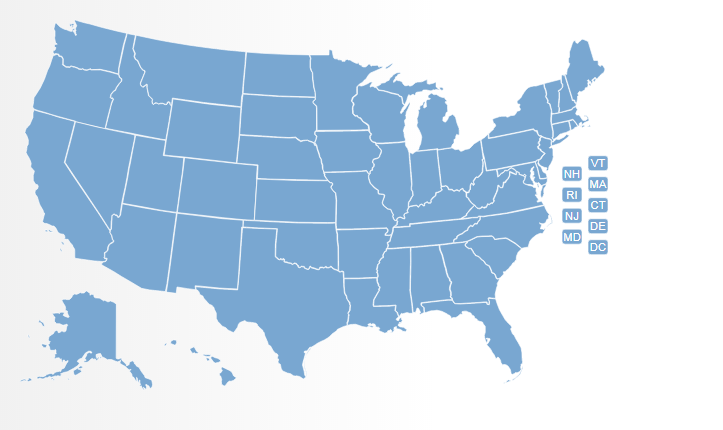
Click Below on Your Area of the Country

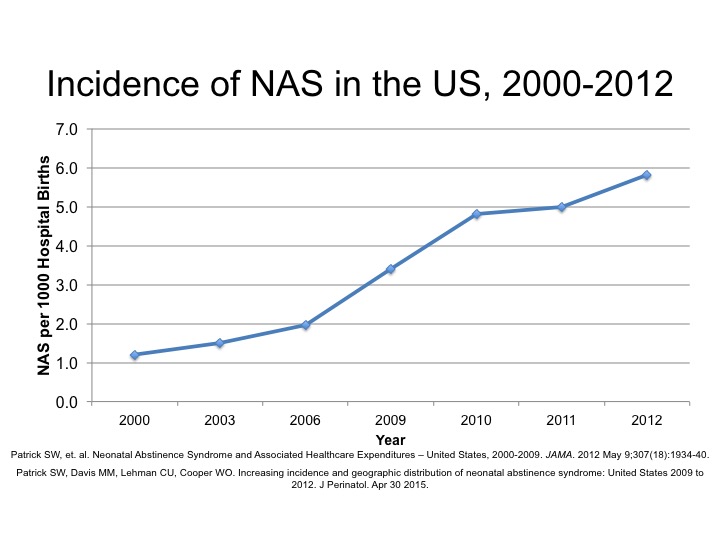
Source: Patrick SW, Davis MM, Lehmann CU, Cooper WO. Increasing Incidence and Geographic Distribution of Neonatal Abstinence Syndrome: United States 2009-2012. Journal of Perinatology.
Data presented are from analysis of the Kids' Inpatient Sample 2012
Counter:
-
A new interactive map from the Agency for Healthcare Research and Quality (AHRQ) allows users to explore state-specific information about opioid-related hospital stays. The map uses data from 44 states and the District of Columbia, including: hospitalization trends from 2009 to 2014, patient sex, age group, geographic area, and income.
Click here to use this interactive tool: https://www.ahrq.gov/news/opioid-hospitalization-map.html#.WYiZR5Xb1Gw.link
-
The CDC has launched new online maps that show annual opioid prescribing rates from 2006 to 2016, both by state and by county. This new resource includes data not previously reported elsewhere: prescribing rates at national, state and county levels in 2016 and prescribing rates for all states and all counties from 2006 to 2016. The maps are interactive, equipped with the ability to zoom in and out and hover over a county or state for the prescribing rate.
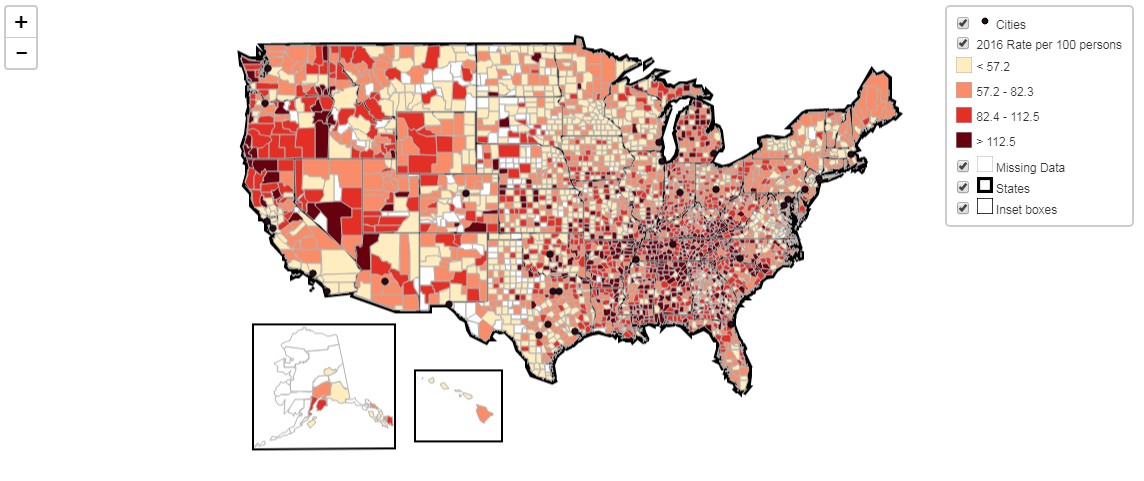
Click here to use this interactive tool: https://www.cdc.gov/drugoverdose/maps/rxrate-maps.html